Project Report: Predicting Country-Level Happiness Scores
Project Overview
This project investigates the relationship between countries’ happiness scores and key economic and social indicators. It aims to build a robust predictive model while addressing data quality challenges such as missing values and inconsistent formatting. The output includes complete data cleaning, exploratory data analysis (EDA), model development, evaluation, and interpretation.
Dataset Description
The dataset combines multiple global indicators for 130 countries, including:
- Year: The year for which the data is recorded(2015-2023)
- Country: The name of the country.
- GDP_per_capita: Gross Domestic Product per capita, which is a measure of a country’s economic outout per person.
- Education_Attainment: Percentage of the population aged 25 and older who have completed at least a bachelor’s degree or equivalent tertiary education.
- Life_Expectancy: The average number of years a person is expected to live.
- Unemployment_Rate: The percentage of the labour force that is unemployed.
- Happiness Score(target): A metric measuring the self-reported happiness of individuals in a country.
Data Preprocessing
- Data Reshaping
- Removing Non-Country Entries for Dataset Integrity
- Removing Country Mismatches Against 2023 Target Set
- Standardising Country Names Across Datasets for Reliable Merging
Cleaning Steps(Chat GPT)
-
Education_Attainment:
- Missing values filled using country-wise median.
- Remaining nulls filled with overall median.
-
Life_Expectancy:
- Applied country-wise linear interpolation.
- Remaining missing values filled with overall mean.
-
Final dataset contains no missing values.
- Outputs:
gpt_merged_dataset.csv
Exploratory Data Analysis (EDA)
- GDP per capita shows a strong positive correlation with Happiness Score (linear trend observed).
-
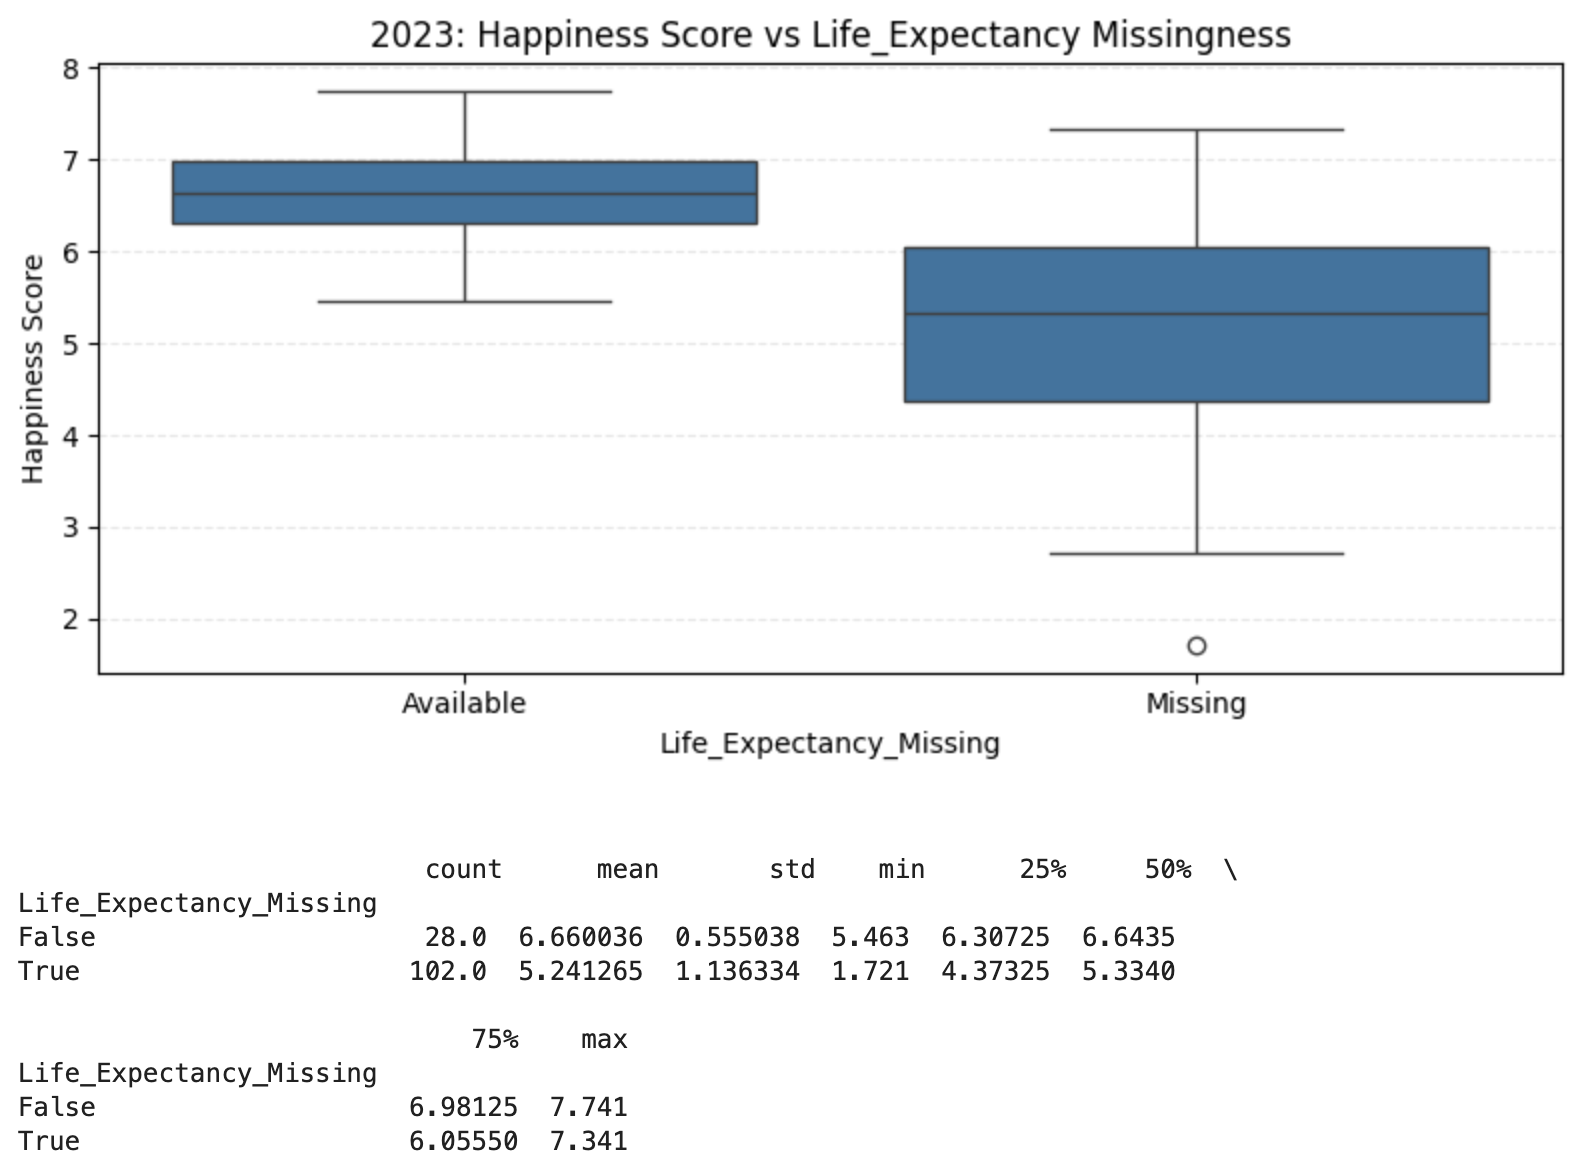
Impact of Life Expectancy Missingness on Happiness Score
- Countries missing Life Expectancy data in 2023 showed significantly lower average Happiness Scores (mean ≈ 5.24) compared to those with available data (mean ≈ 6.66).
- Countries with available 2023 life expectancy data tend to report higher minimum happiness scores and tighter variance, implying they may be technologically advanced or more transparent.
- Although the mean happiness score is clearly lower for countries with missing life expectancy data, the imbalance in group size (103 vs 28) suggests caution in interpreting statistical differences.
- The absence of data in other countries might not directly reflect poor life expectancy, but could stem from limited data infrastructure, delayed reporting cycles, or geopolitical factors.
- Identified a few outlier countries with low GDP per capita but high Happiness Score — flagged for further qualitative analysis.
- Visualised trends using scatter plots, pairplots, and correlation heatmaps for cross-feature relationship assessment.
Post Cleaning Steps
- Lebanon (2023) GDP per capita manually set to 3350 (source: TradingEconomics).
- Applied country-wise linear interpolation for:
Education_AttainmentLife_Expectancy
- No global imputation needed after interpolation.
- Final dataset contains no missing values.
- Outputs:
-
merged_dataset_v1.1.csv(manual fix) -
merged_interpolated.csv(interpolated version)
-
Modelling
Model: RandomForestRegressor
- Trained on cleaned dataset, using features from 2023 for final test.
- Feature Importance: GDP > Life Expectancy > Unemployment > Education
Performance Comparison
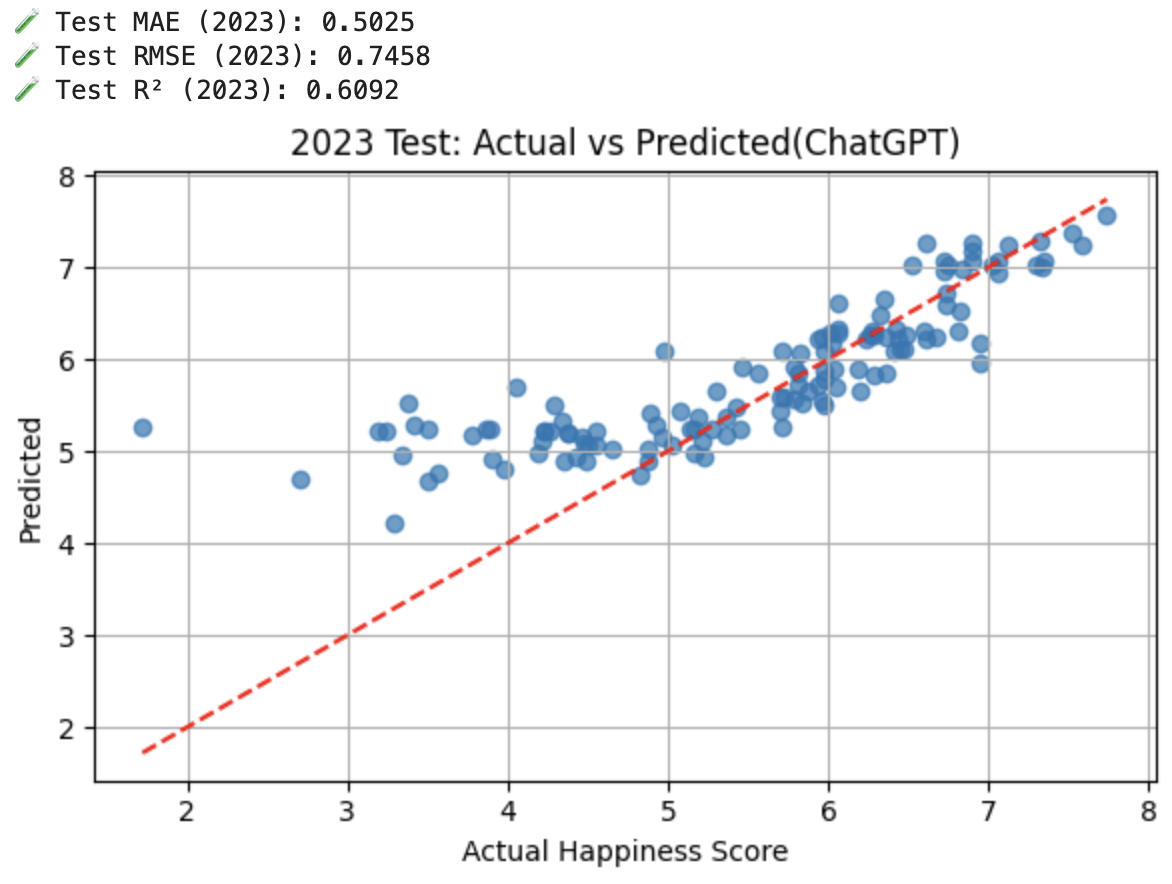
-
Model A: Trained on the dataset with missing values filled with ChatGPT.
-
Model B: Trained on the interpolated dataset using country-wise time-series imputation.
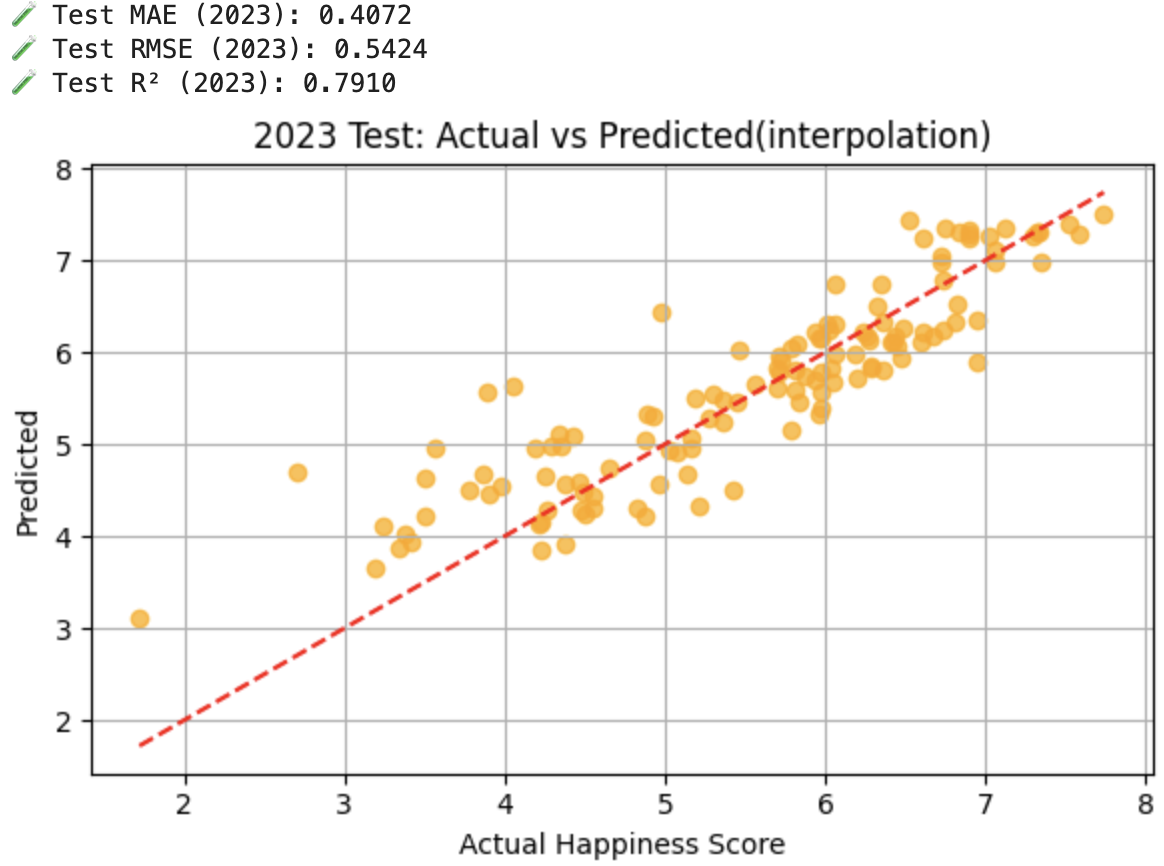
- No overfitting observed: Validation and Test performance are consistent.
- R² ~0.8 indicates strong predictive power.
Conclusion & Insights
- The model successfully predicts national happiness based on quantifiable indicators.
- Cleaned data greatly improved predictive performance (compared to R² ~0.6 on unoptimised data).
- Results suggest that economic strength, education, and health indicators are key drivers of national happiness.
- However, the model shows a tendency to underestimate happiness scores for low-GDP countries, indicating an over-reliance on GDP-related features.
- This highlights the need for further feature engineering to incorporate non-economic factors—such as cultural, social, or environmental elements—especially for economically weaker nations, to better capture the multifaceted nature of happiness.
Feature Importance
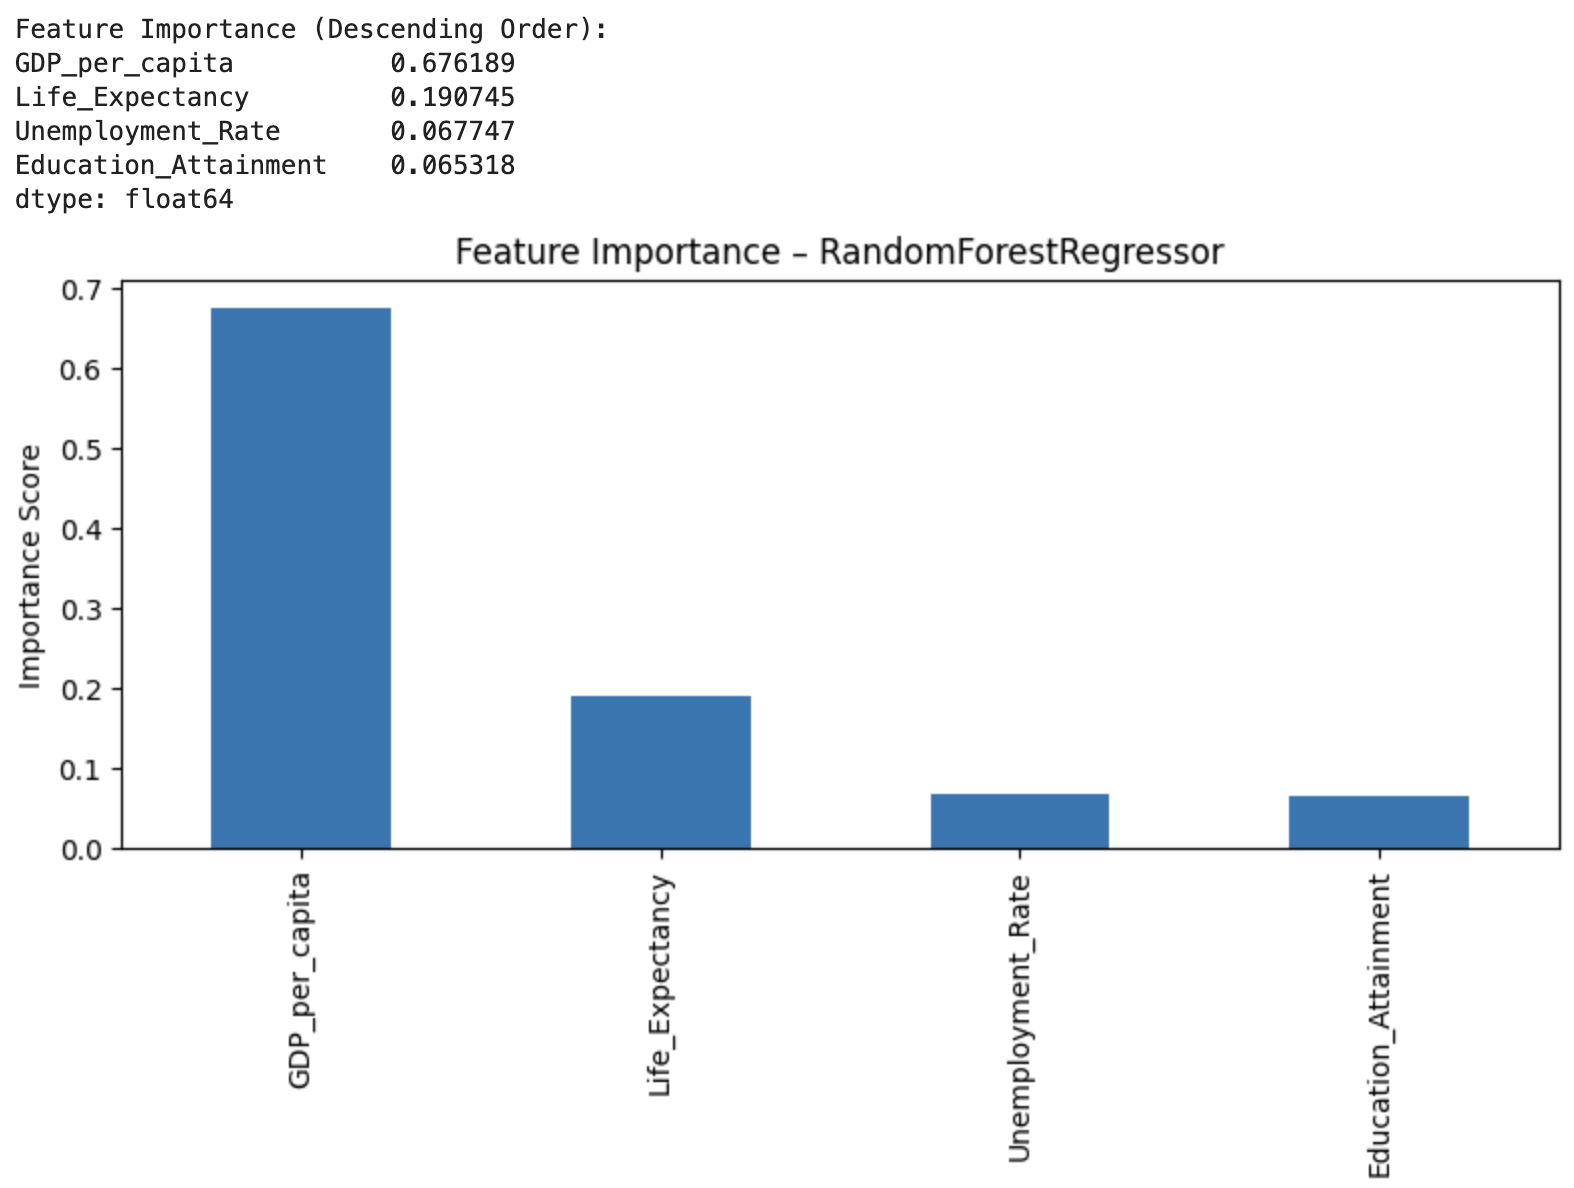
Feature Importance Analysis
- The model heavily depends on GDP per capita (
importance = 0.676), far outweighing other features such as:- Life Expectancy (
0.19) - Unemployment Rate and Education Attainment (each ~
0.06)
- Life Expectancy (
- This strong GDP dominance in feature weighting confirms a structural bias: the model learns to associate happiness primarily with economic strength.
Hypothesised Causes of Underestimation:
- Feature bias: Overweighting of GDP leads to undervaluing happiness in countries where non-economic factors matter more.
- Incomplete data: Low-income nations often have more missing values, leading to less informative or averaged inputs.
- Sample imbalance: High-GDP countries may be overrepresented in the training set, skewing the learned patterns.
- Omitted variables: Factors like social trust, freedom, cultural values, and community resilience—which contribute meaningfully to happiness—are not currently modelled.
In short, the model is accurate for high-GDP countries but systematically undervalues subjective well-being in lower-income contexts. Expanding the feature space beyond economics is essential to build a fairer and more generalisable model.
Next Step
- Reduce GDP-dominance bias by integrating non-economic predictors such as social trust, freedom of choice, generosity, and perceived corruption—especially for underrepresented low-GDP countries.
- Incorporate qualitative and geopolitical indicators (e.g., governance quality, safety perception, civil liberties) to capture hidden dimensions of happiness.
- Perform targeted feature engineering informed by outlier analysis to uncover latent drivers in countries with high happiness but low GDP.
- Explore region-specific models or interaction terms to address structural differences in how happiness is formed across countries.
- Apply clustering and temporal modelling to detect evolving happiness dynamics and localised trends.
Programming Language
![]()
Data Analysis & Processing
![]()
![]()
Machine Learning
![]()
Data Visualization
![]()
![]()
Development Environment
![]()
Citations
License & Attribution
This project is for educational purposes and submitted as part of CS50’s Introduction to Computer Science 2025 Final Project.
Note: AI-based tools (ChatGPT) were used to assist with structuring the project design but all data handling, analysis, and coding are the author’s original work. AI assistance is acknowledged as required by CS50 guidelines.